
Set your spare fleet size with one formula: Spare Vehicles = (Active Fleet × Average Downtime %) + Safety Stock. Before you can run it, pull two numbers from your maintenance system: fleet downtime percentage and average repair time (MTTR). Everything else in your backup vehicles strategy, from cost tradeoffs to rotation policy, builds on those two figures.
TL;DR:
- Maintaining a spare fleet equal to 13 percent of vehicles ensures sufficient coverage, given an 87 percent uptime that leaves six or seven trucks down daily in a 50-vehicle fleet.
- The optimal spare vehicle count is based on the fleet’s downtime percentage and mean repair time, with safety stock added to account for seasonal fluctuations and failure rates.
- Converting from reactive to predictive maintenance can cut unplanned downtime by about half, reducing spare vehicle requirements and overall costs.
- A tiered operating model—dedicated, shared, or hybrid rental pools—helps balance cost and risk depending on vehicle predictability and service criticality.
- Continually monitoring utilization, readiness, and downtime data, and adjusting the spare count seasonally and after maintenance reviews, maintains effective backup capacity.
Table of Contents
- What Does a Backup Vehicles Strategy Actually Cost You?
- How Do You Calculate Optimal Spare-Vehicle Capacity?
- Reactive vs. Predictive Maintenance: Which Cuts Your Spare Needs?
- Choosing a Spare-Pool Operating Model That Holds Up
- Building a Monitoring Plan That Justifies Your Spare Count
- Do Vehicle Type and Usage Pattern Change Your Spare Math?
- Where Does Backup Vehicle Strategy Fit Into Fleet Management?
- Balancing Continuity and Capital: An Operator's View
- Managed Ground Transport That Treats Continuity as the Standard
- Sources
- FAQ
What Does a Backup Vehicles Strategy Actually Cost You?
Every spare vehicle sitting in a lot is a bet. You're betting that the cost of owning idle capacity is lower than the cost of scrambling when a unit breaks down mid route. Both sides of that bet have real numbers attached, and most fleets never run them side by side.
Carrying costs stack up fast:
- Depreciation on a vehicle that logs fewer miles than an active unit but loses value at nearly the same rate
- Insurance premiums, which apply whether the vehicle moves or not
- Storage and yard space, plus registration and tags
- Opportunity cost of capital tied up in a vehicle instead of maintenance tech, telematics, or route expansion
Statistic Callout: A fleet running at 87% uptime will statistically have close to 13% of its vehicles down at any given moment. For a 50-vehicle fleet, that's six or seven trucks unavailable on an average day, not a bad-luck outlier.
Compare that against undercoverage: a missed route costs you the revenue, plus the client relationship risk, plus whatever a same-day rental or outsourced carrier charges to cover the gap. Run a simple test: price one owned spare's annual carrying cost against renting a replacement for the number of missed-route days you had last year. Finance will ask for exactly this comparison, and operations will ask how often the spare actually got used.
How Do You Calculate Optimal Spare-Vehicle Capacity?
The formula behind any credible backup vehicles strategy is short: Spare Vehicles Needed = (Total Active Fleet × Average Downtime %) + Safety Stock.
Two inputs drive the whole calculation:
- Average downtime % = total downtime hours ÷ total available hours, measured over a rolling 12-month window to smooth out seasonal noise.
- MTTR (mean time to repair) = total repair hours ÷ number of repair events, which tells you how long each downtime episode actually lasts.
Safety stock is the buffer on top of the math, typically 1 to 2 vehicles per 50 active units, sized up for seasonal peaks or aging asset segments where failure rates climb.
Round up to 2 spares total.
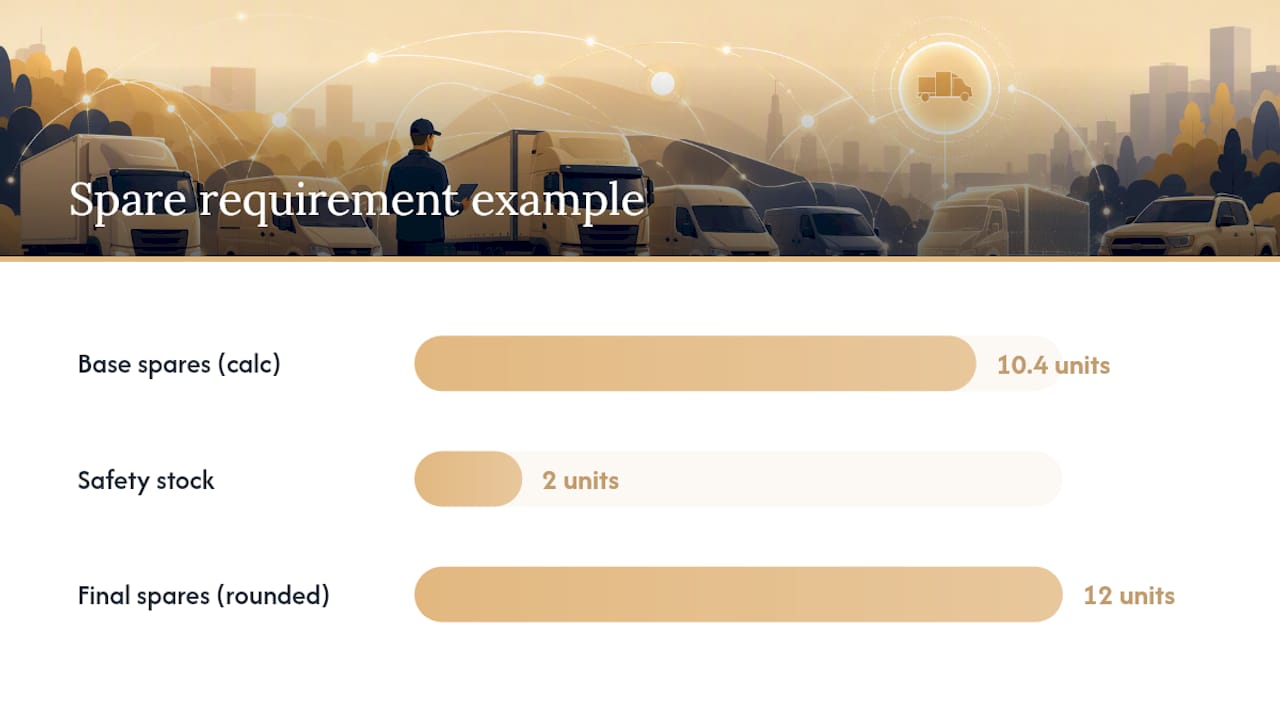
Worked example B: An 80-unit fleet at 13% downtime needs 10.4 spares from the base calculation (80 × 0.13), plus 2 safety stock units, landing at 12 spares after rounding.
Always round up, never down. A fractional spare doesn't exist on the lot, and rounding down is how fleets quietly under-provision for years without noticing.
Reactive vs. Predictive Maintenance: Which Cuts Your Spare Needs?
Reactive maintenance means you fix a vehicle after it fails. Predictive maintenance means you catch the failure signal before it strands a driver. The gap between them shows up directly in your spare count.
Reactive shops tend to run longer MTTR, because diagnosis starts from zero once a vehicle is already down. That stretches the downtime percentage in your formula and forces a bigger spare pool to compensate. Predictive maintenance compresses that window: repairs get scheduled, parts get ordered ahead of failure, and vehicles come out of service for planned, shorter windows instead of open-ended ones.
Statistic Callout: Converting from reactive to predictive maintenance can roughly halve unplanned downtime, which flows straight through to a smaller required spare fleet under the same formula.
The tradeoff isn't free:
- Predictive tools carry a subscription or sensor-hardware cost, plus setup time
- Procurement lead times for replacement parts still matter even with early warning
- Rental and vendor availability during peak season can bottleneck either strategy
Run the ROI comparison in dollars: the annual cost of a predictive maintenance platform against the carrying cost of the extra spares you'd need without it. For most mid-size fleets, the breakeven point arrives faster than expected once downtime percentage drops even two or three points.
Choosing a Spare-Pool Operating Model That Holds Up
Three models cover most fleets, and the right one depends on how predictable your risk is.
Dedicated pool: you own every spare outright. This fits fleets with specialized vehicle types where rentals aren't available on short notice, or where client contracts demand guaranteed continuity.
Shared pool: spares are pooled across depots or business units, reducing total count needed while requiring coordination to move a vehicle to wherever the failure happens.
Rental hybrid: you carry a smaller owned pool and lean on pre-verified rental partners for overflow. This tends to give the best cost-risk balance for fleets without heavy specialty requirements.
A tiered reservation policy keeps the pool from getting raided by low-priority requests:
- Tier 1 (client-facing SLA routes): first claim on dedicated spares, no exceptions.
- Tier 2 (internal operations): shared-pool access, subject to availability.
- Tier 3 (non-critical or administrative use): rental hybrid only.
Deployment needs a clear authorization chain: who approves pulling a spare, who notifies the client or dispatcher, and who logs the odometer and condition on both vehicles during the swap. Build a short equipment-transfer checklist too, covering telematics units, decals, toll transponders, and any client-specific gear that has to move with the driver.
Pro Tip: Rotate reserve vehicles into light-duty active service monthly. It surfaces mechanical issues before an emergency deployment does, and it keeps mileage and battery health balanced across the whole spare pool.

Pre-peak season, run a full readiness check on every spare, not just the ones scheduled to work. Peak-season plans built on pre-verified backup arrangements consistently outperform ones assembled after the first breakdown call comes in.
Building a Monitoring Plan That Justifies Your Spare Count
A spare ratio that nobody reviews eventually drifts. It grows because a manager once got burned by a shortage, or shrinks because nobody flagged rising utilization. A monitoring cadence keeps the number evidence-based instead of habit-based.
Track these on a rolling basis:
- Daily: uptime %, active outages, spares currently deployed
- Weekly: MTTR trend, spare utilization rate, outage root causes
- Monthly: spare readiness score (percent of spares that passed their last inspection), rental partner response times
| Review cycle | Key metric | Trigger for action |
|---|---|---|
| Weekly | Spare utilization rate | Utilization above 80% sustained for 3+ weeks |
| Monthly | Spare readiness score | Any spare failing inspection twice in a quarter |
| Quarterly | Downtime % vs. spare formula output | Actual spare need drifts significantly from current pool size |
Every quarter, rerun the formula against fresh downtime and MTTR data, and compare it to your actual pool size. Log every deployment against the vehicle it replaced, including cause, repair duration, and utilization, so the audit trail supports whatever number you land on. Internal readiness documentation, like a flight-disruption contingency plan, follows the same principle: write down the trigger, the response, and the outcome every time.
Do Vehicle Type and Usage Pattern Change Your Spare Math?
Yes, and treating every vehicle class the same is one of the more common sizing mistakes. A sedan running short urban routes fails differently than a box truck running long highway hauls, and your spare ratio should reflect that.
High-mileage, high-duty-cycle vehicles wear components faster and post higher downtime percentages, which pushes their segment's spare count up even if the fleet average looks fine. Specialty vehicles carry their own complications. Electric vehicles involved in incidents often need flatbed towing, isolated storage, and extended monitoring before they're cleared for return to service, stretching MTTR well beyond a comparable combustion vehicle's repair window. If your fleet mixes EVs with conventional vehicles, run the spare formula separately for each segment rather than blending them into one downtime percentage that hides the EV segment's real risk.
Seasonal usage matters just as much. A vehicle class that runs light in Q1 and doubles its duty cycle in Q4 needs its safety stock sized for the peak, not the average. Fleets that size spares off annual averages routinely get caught short exactly when demand is highest, which is the same season client tolerance for delay is lowest.
Segment your spare calculation by vehicle class, duty cycle, and seasonal pattern. A single fleet-wide number is faster to compute and consistently wrong for at least one segment.
Where Does Backup Vehicle Strategy Fit Into Fleet Management?
A spare-vehicle plan that lives apart from your maintenance schedule will fight it. Every input to the sizing formula, downtime hours, repair duration, failure frequency, comes from the same maintenance data your team already tracks. Treating spare sizing as a separate exercise means running two versions of the truth.
The practical fix is to fold spare-pool review into your existing maintenance planning cycle. When you schedule preventive maintenance for the active fleet, schedule readiness checks for the spare pool in the same cycle. When a maintenance manager flags a vehicle segment with rising failure rates, that's the same signal that should trigger a spare-stock review for that segment.
Procurement planning benefits too. If your fleet replacement schedule already tells you which units are approaching end of life, that data should feed directly into safety-stock sizing for the segments about to see rising downtime. Aging assets don't fail gradually; they cluster failures near the end of their service life, and a spare plan that ignores the replacement schedule gets blindsided by exactly the clustering the maintenance team already saw coming.
Route planning connects here as well. A disciplined route framework that builds in flexibility can absorb some disruptions without ever touching the spare pool, which means route resilience and spare sizing aren't separate levers. They're two ways of managing the same risk, and the fleets that treat them as one integrated plan carry less total capacity for the same level of protection.
Balancing Continuity and Capital: An Operator's View
Client-facing service work doesn't get to run at 87% uptime and call it acceptable. When a production needs a vehicle at a set or a network executive needs to make a flight, "statistically fine" isn't a standard anyone accepts. That's why reserve readiness for SLA-critical routes gets prioritized ahead of the general fleet, every time, in how we think about capacity.
The discipline behind a flight-disruption contingency plan or a tested route-planning framework applies just as well to spare-vehicle sizing: pre-verify your backup before you need it, not after.
Three signs your spare plan is failing before a crisis proves it: utilization sitting above 80% for weeks without a resize conversation, spares that haven't been rotated into active duty in over a month, and no one able to say what your current downtime percentage actually is.
— Sammy
Managed Ground Transport That Treats Continuity as the Standard
A managed ground transport provider offers an alternative to piecing together contingency coverage from ad hoc rentals: a fleet structured around production and executive travel schedules where a missed pickup isn't an option, backed by 24/7 rapid response and direct access to ownership instead of an app queue.

That matters most for the exact scenarios this guide covers: a talent pickup that can't slip, a set logistics run that needs a backup vehicle staged and ready, an executive itinerary where the on-time guarantee has to hold regardless of traffic or mechanical surprise. Our chauffeurs and vehicles support corporate travel programs and production transport with the same readiness principles laid out above: pre-verified capacity, tiered priority for client-facing routes, and documented contingency response drawn from decades in entertainment industry logistics.
If your team is weighing whether to build internal spare capacity or lean on a managed provider for peak periods and high-stakes moves, start with a conversation. Request a proposal through Riga Global Travel and walk through your current coverage gaps with a team that has planned around them for 40-plus years.
Sources
- How Many Spare Vehicles Should the Fleet Carry?
- Backup Vehicle Plan: 4 Important Points For Peak Season
- Fleet Spare Vehicle Pool Strategy: Uptime Guide
FAQ
What Is the Best Backup Vehicle Strategy for a Fleet?
The strongest approach combines a data-driven spare formula, Active Fleet × Downtime % plus safety stock, with a hybrid operating model that pairs a smaller owned pool with pre-verified rental partners. Predictive maintenance on top of that formula further shrinks the spare count you actually need.
What Is the 3/2/1 Rule for Backing Up Vehicles?
There's no standardized "3/2/1 rule" for physical backup vehicles the way there is for data backups; that framework belongs to IT storage, not fleet operations. The equivalent fleet discipline is the spare-sizing formula covered above, paired with tiered reservation rules by criticality.
How Do I Know if I Have Enough Backup Vehicles?
Compare your current spare count against the formula output using your real downtime percentage and safety-stock guidelines.
What Is the Best Way to Back Up a Vehicle-Dependent Operation?
Layer your protection: internal spares sized by the formula, pre-verified rental partners for overflow, and route flexibility that reduces how often you need a spare at all. For client-facing or production-critical work, providers like Riga Global Travel build that layered readiness into managed ground transport so continuity isn't dependent on your internal fleet alone.
How Often Should I Recalculate My Spare Vehicle Ratio?
Seasonal fleets should also run the calculation ahead of known peak periods rather than waiting for the standard quarterly cycle.